|
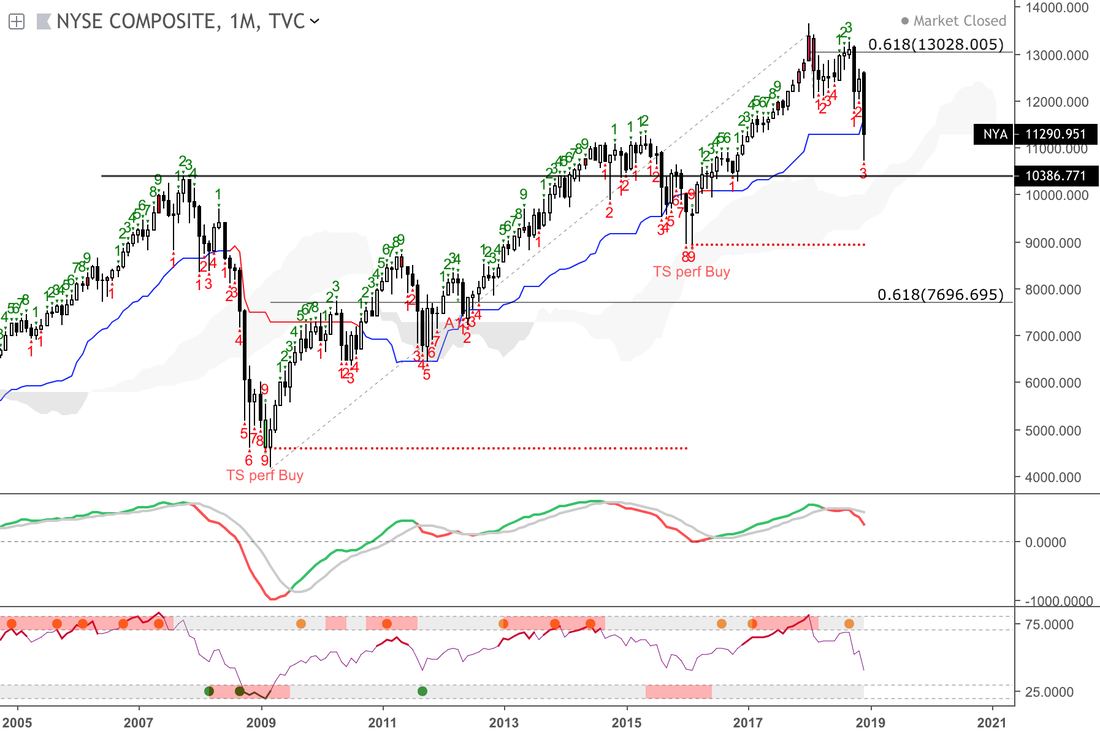
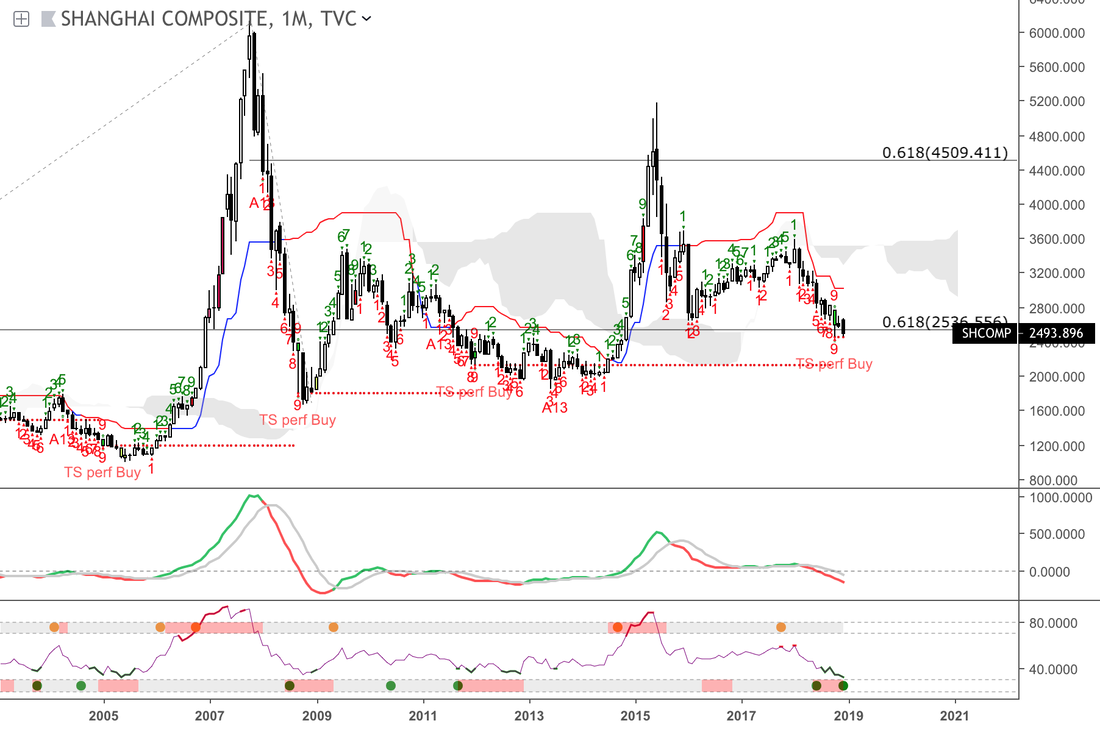
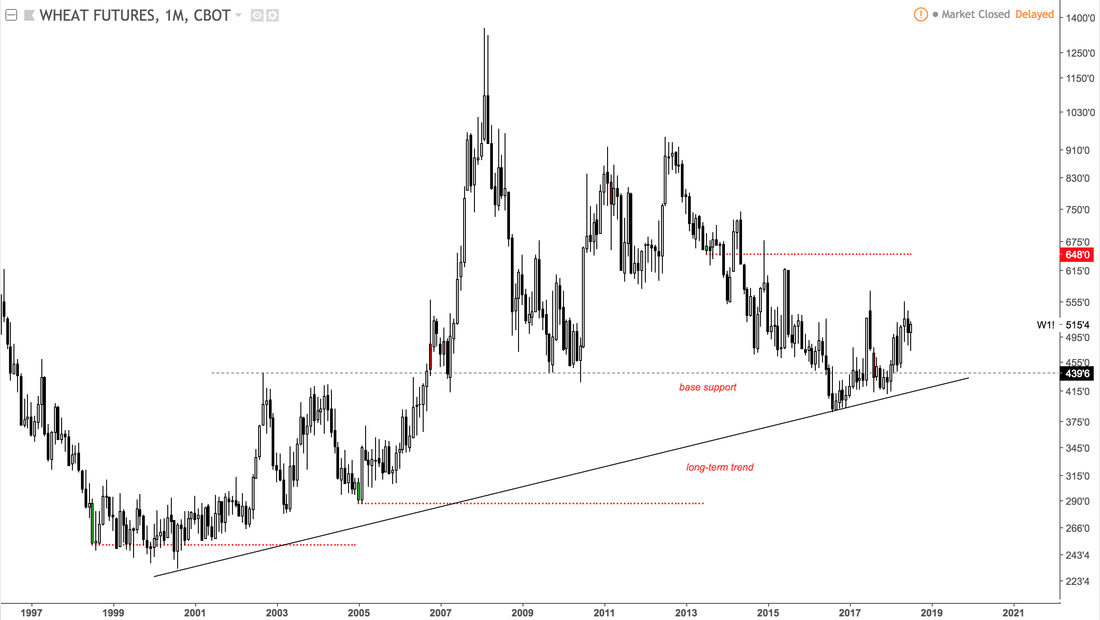
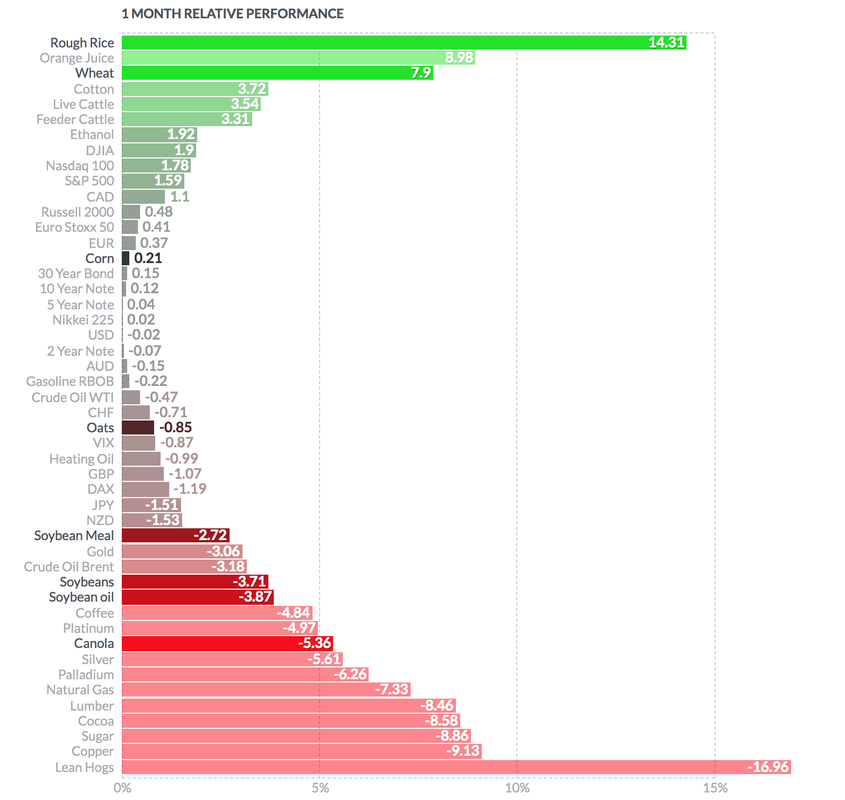
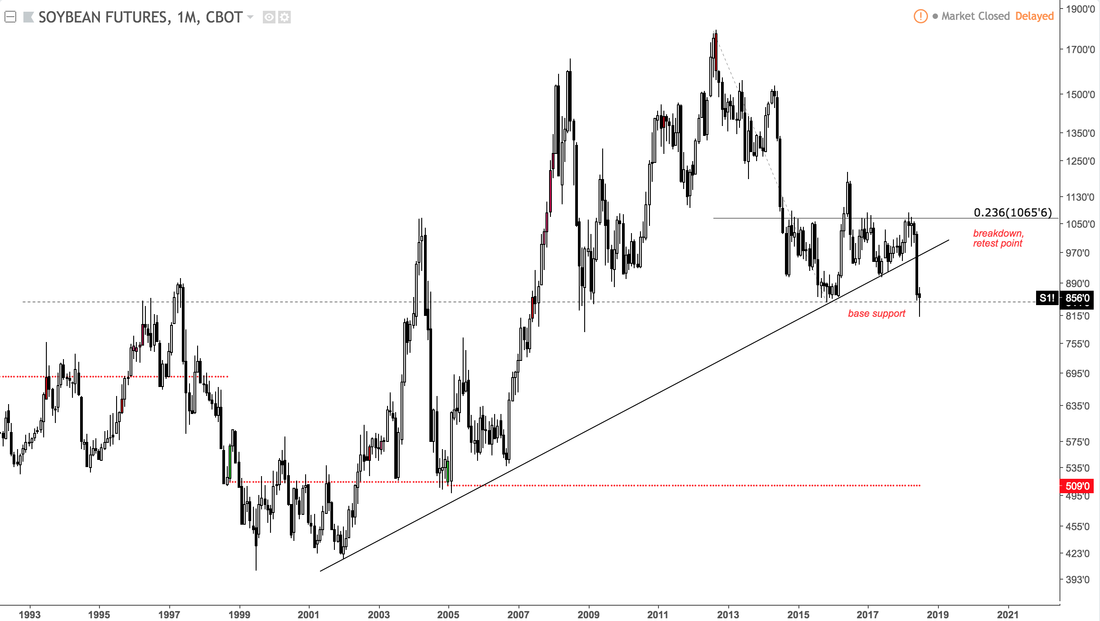
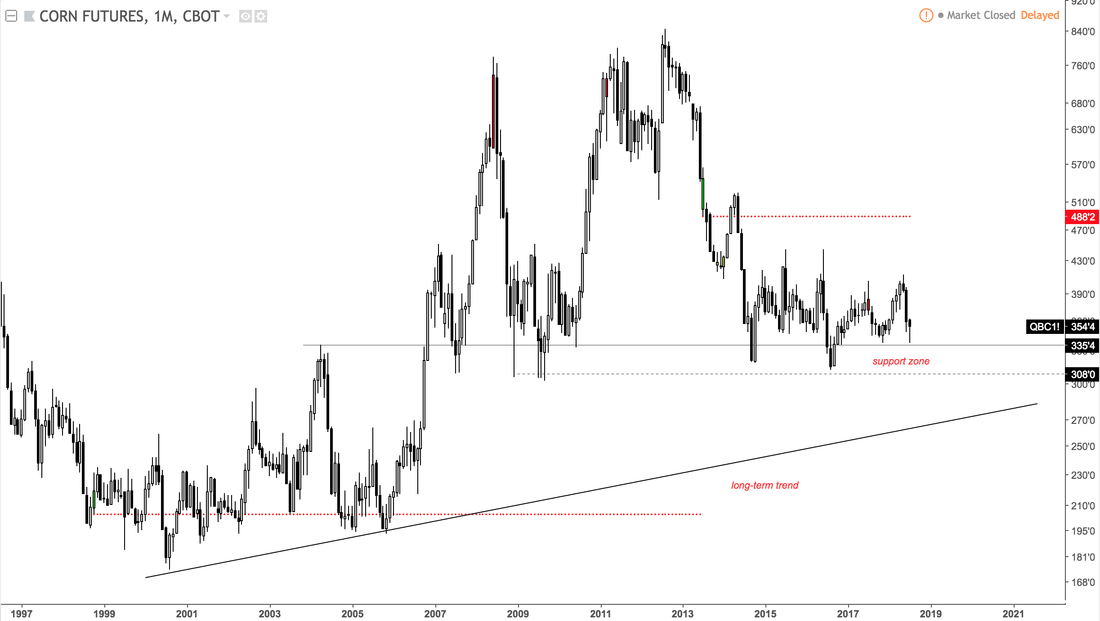
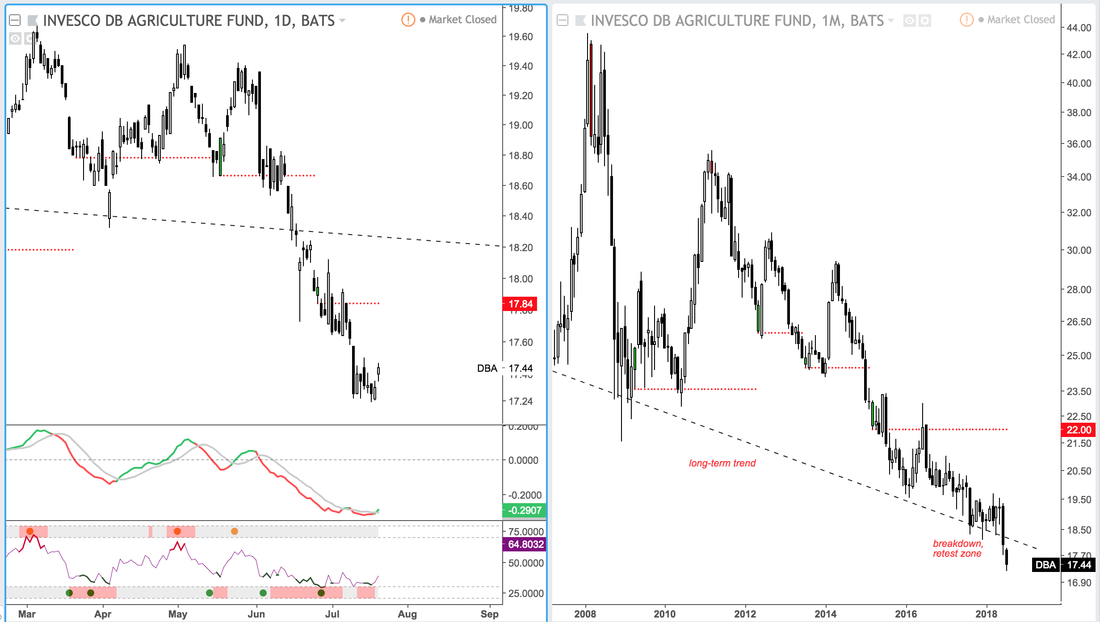
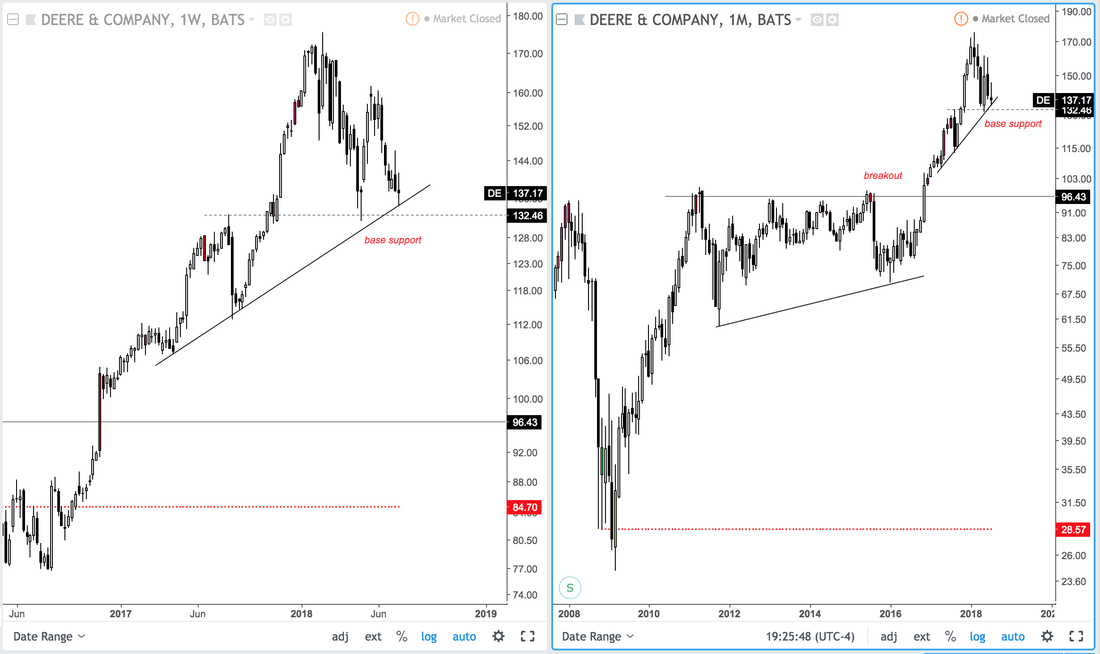
When two years of accelerated buying activity suddenly halts, all investors should pay attention. That's the case with the NYSE Composite, which includes more than 1,900 stocks including foreign listings. The NYSE Composite registered upside price exhaustions on four occasions over the past market cycle beginning around 2008, and at each exhaustion price momentum decelerated ahead of significant corrections. This time, a strong level of support is nearby which could mark a price low, but not necessarily the low for stocks. International equities like China register better long-term price lows, which could attract greater money flow relative to U.S. equities during a coming relief rally. However, the decline in momentum since 2014 despite new price highs in the NYSE Composite earlier this year warrants caution for 2019. The massive sell-off in grains is slowing, which could offer relief for traders experiencing whiplash from volatility. Long-term charts show attractive support zones for wheat, corn, and soybeans with trend-lines covering nearly two decades of extreme price lows. Investors will likely find better long opportunities in wheat and corn as individual stocks such as Deere & Company (DE) trade near critical support levels. Wheat holds above base support The monthly chart of wheat futures shows a confluence of support from the early 2000's which should help prices recover from the 2013-2017 sell-off. Further, despite recent headline risk, wheat prices maintained buyer interest, evidenced by a positive increase in managed money positions as of the July 17 COT report. As buyers return, wheat prices are leading the overall counter-trend recovery in grains based on one-month relative performance. Soybeans counter-trend bounce likely The price recovery in soybeans should continue towards the 9.70 trend-break area from earlier this year. A critical break of a nearly two decade long trend of rising price lows is important, and could keep sellers active as the recovery matures. Trading towards a re-test offers an attractive reward-to-risk as a tactical counter-trend opportunity, especially given extreme bearish sentiment. Corn defends support zone Holding above 3.00-3.35 is important for corn futures, which struggled to maintain higher price lows from 2015. The recovery is muted, albeit with a gradual build in momentum. Prices still register overbought signals, so expect some choppy moves before a return towards the 4.00 level. Counter-trend bounce in Agriculture ETF DBA holdings consist of a mix of agriculture, concentrated in grains, which includes a 14.15% weight in soybeans, 11.88% in wheat, and 9.87% in corn. As a result, the counter-trend bounce in DBA resembles the chart pattern in soybeans. Daily and monthly charts below show a short-term recovery from the break-down zone with improving momentum and oversold levels. A recovery towards 17.84 and 18.20 appears likely. Deere & Company (DE) at key support DE marked an impressive breakout in 2017 and continued to hold a series of price lows into 2018. Currently, 132.46 represents an important support zone from a year long base and up-trend. Negative momentum is a concern, which means traders will need to wait for confirmation of a price close above last week's range. A breakdown below support in DE and continued bearishness in grain futures would negate a near-term bull case. |
AuthorDamanick Dantes, CMT Archives |
 RSS Feed