Dantes Outlook
  • Market Intelligence
  • Past Insights
  • Long-Term Value
Picture
The following analysis reveals recent market shifts, including weakened momentum in global equities and a defensive rotation toward intermediate-term Treasuries and select commodities like gold. Ultimately, the outlook suggests moving away from a purely US-centric allocation. The tactical approach blends various indicators and adapts to evolving market environments to build resilient portfolios. 
​Listen to an AI-generated summary, or read the full outlook below:


​The Content is for informational purposes only and does not reflect holdings. ​Information or other material is not investment advice. ​
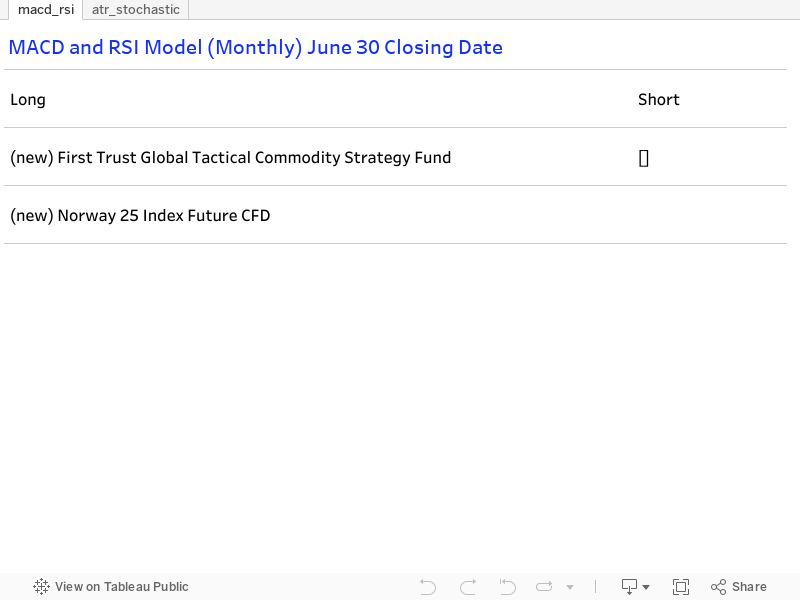
Executive Summary
March 2025

Technical Process

Maintaining investment discipline is critical to managing risk, ensuring consistent decision-making, and staying aligned with long-term objectives. Tools like trend indicators and price dispersion analysis have proven helpful in identifying attractive entry points and uncovering undervalued opportunities.

However, it is important to acknowledge the limitations of relying heavily on historical data. Market dynamics evolve, and past performance does not always indicate future behavior. Additionally, the efficiency of markets can dampen the predictive power of some strategies. For example, we find that mistiming entry and exit points typically occur when prices have deviated far beyond historical averages. Prices can become increasingly "overbought/overvalued" or "oversold/undervalued" as prevailing price trends persist. 

While trend-following strategies can be effective over longer horizons, they may be vulnerable during short-term volatility, which can increase drawdown risk. Mean reversion approaches, by contract, may offer short-term opportunities when dispersion widens and trends begin to weaken. Over time, these mean reversion tilts can compliment or hedge an existing core position, incrementally rotating into more favorable trends.

For advisors, the key lies in applying these strategies thoughtfully and adapting them to fit a range of market environments - balancing conviction with flexibility to support more resilient client portfolios. 
​Instead of positioning solely on oversold/overbought signals, our work shows that blending indicators such as momentum, trend, and dispersion can help optimize investment strategies.

Combo Models

Trend & Momentum

The MACD/RSI model works best in trending environments, and requires a mean-reversion layer to adapt to changing market regimes. The model captures renewed price strength within the direction of the prevailing trend. However, continuous price rises and falls do not last forever. Over time, price trends may become extended and experience a reversal. Z-scores can be used to measure price deviations from the historical average.

Opportunities may appear as price action shifts away from extremes with increasing momentum, measured by the z-score and MACD/RSI model. While it is difficult to time an exact reversal point, long-term momentum shifts can aid in the gradual rotation away from decaying trends toward emerging trends. We found the MACD/RSI model to produce the best historical results in commodities and equity indices rather than currencies.

The ATR/Stochastic model enhances currency trading strategies by combining Average True Range (ATR) and a Stochastic oscillator. ATR measures the degree of price volatility, providing insights into the normal price range movements, which helps in setting stop-loss and take-profit levels. The Stochastic oscillator, on the other hand, identifies overbought and oversold conditions, signaling potential reversal points. This combination offers a robust approach to capturing trends and reversals in currency pairs.  
​
The MACD/BB model is a recent enhancement to our trend following process. The model relies on the nature of Bollinger Bands to assess market volatility and trend strength, while the MACD confirms momentum shifts, enhancing signal reliability. When these two studies are used together, they give a clearer picture of market conditions. For example, if the Bollinger Band shows that prices are moving strongly in one direction and the MACD agrees, this may suggest a continuation of the prevailing trend. We found this combination to be most reliable based on historical price data across major equities, commodities, and currencies.
Commodities and Treasuries have shown relative strength versus equities, supporting the case for balanced allocations as part of a multi-asset framework.
Equities:

Global equity markets entered 2025 with weak momentum, accompanied by subtle shifts in regional leadership. The S&P 500 Index saw its z-score edge lower from 1.90 to 1.82, reflecting a loss of upward momentum while still trading above its historical average. Momentum scores as of last month weakened notably, and technical models have yet to support renewed buying. However, the S&P 500 dipped below its 20-month moving average during the first week of April, which, if confirmed by month-end, could generate sell signals based on our criteria.

China's CSI 300 Index held its z-score at -0.17 and improved from deeply oversold levels seen last quarter. While not yet signaling a sustainable uptrend across all models, the ATR/Stochastic model shifted from a long signal to “hold” as the rally in Chinese equities broke above resistance. The Hang Seng Index shows a similar setup: oversold z-score levels combined with strong momentum and a first technical “long” trigger in the quarter.

The FTSE 100 broke above its multi-month consolidation phase with improved momentum, reflected in its z-score move from 1.60 to 1.51. The index remains in a long-term uptrend, while other technical models are neutral after signaling oversold buy conditions in recent months.

In contrast, Japan’s Nikkei 225 remains elevated with a z-score of 2.06. Momentum signals weakened across the board, and no technical models currently support fresh long exposure. The risk of overbought conditions continues to grow.

Our quality momentum screen (Q-MoM) reveals that China, Hong Kong, and Brazil — despite high 6- and 12-month generic momentum (GM) scores — continue to display discrete rather than continuous momentum, suggesting that recent price strength is driven by short-term swings, not necessarily sustained buying pressure. These markets are best viewed as tactical trades rather than strategic longs. Meanwhile, US equities appear stretched, while European indices maintain a more balanced z-score and momentum profile, offering relative appeal.

Fixed Income:

The fixed income market saw a notable reversal in Q1 2025, with several bond segments experiencing sharp improvements in sentiment and technical strength.

The US Aggregate Bond Index ETF (AGG) saw its z-score rise from -1.49 to 0.33, flipping from deeply oversold to neutral, and triggering a new “long” signal on the MACD/RSI model. While still early, this shift reflects renewed investor demand for duration, potentially driven by stabilizing interest rate expectations and rising recession risks.

The US Investment-grade credit ETF (LQD) and the 7–10 year Treasury bond ETF (IEF) followed a similar path to the broader bond index — both have newly positive z-scores and positive long-term GM scores. Government bonds and higher quality credit offer a defensive play amid slowing equity momentum.

The Emerging Market Bonds ETF (EMB) also reversed higher, moving from a z-score of -1.33 to 0.61. The uptrend remains intact, although price has consolidated relative to the US aggregate bond index.

The US High-Yield Bond ETF (HYG) pushed further into stretched territory with a z-score of 1.53. Widening credit spreads suggests caution in riskier credits, evidenced by declining relative strength in high-yield versus investment-grade bonds.

The downtrend in the iShares 20+ Year Treasury Bond ETF (TLT) has stabilized. Momentum signals are neutral, with greater preference for 7-10 year Treasuries over longer duration Treasuries. 

Models indicate a defensive rotation away from overbought equities and into oversold Treasuries, plus selective opportunities outside of the US.
Intermediate-term government bonds and higher quality credit offer a defensive play amid slowing equity momentum.
Commodities:

Commodities delivered divergent signals in Q1 2025, with strength rotating from softs and energy into agriculture and precious metals.

Gold (GC) and Silver (SI) futures remain in solid uptrends, although z-scores moderated slightly from 2.11 to 2.01 and 1.69 to 1.59, respectively. Gold, in particular, remains a core long candidate, supported by dual “long” signals from trend and BB/MACD models. 

Platinum (PL) showed slight improvement in z-score from -0.71 to -0.65, indicating early signs of stabilization within a downtrend. Palladium (PA), in contrast, slipped further to -0.75, with all models remaining neutral.

Corn Futures (ZC) saw a downtick in its z-score (0.12 to 0.07) as price consolidated. Meanwhile, the Invesco DB Agriculture Fund (DBA) saw its z-score surge from 1.99 to 2.47, with improving momentum signals — reflecting strong uptrends in its top holdings of coffee, cocoa, and live cattle. 

Coffee (KC) and Cocoa (CC) held elevated z-score levels despite slight downticks (KC: 2.49 to 2.36, CC: 2.94 to 2.78). Both commodities appear stretched and remain vulnerable to sharp pullbacks.

Soybean Futures (ZS) saw a marginal decline in its z-score (-0.47 to -0.48), and remained in a downtrend. Soybean Oil (ZL) held below zero with no new long signals — implying continued weakness. Wheat Futures (ZW) remained broadly unchanged in z-score (-0.19 to -0.18) and indicators are neutral.

Live Cattle (LE) continued higher (z-score: 1.97 to 2.05), and MACD/RSI flashed a new “long”, reaffirming trend strength. Cotton (CT) weakened (z-score: -0.55 to -0.68) within its downtrend, although the ATR/Stochastic model turned “long”, indicating oversold conditions.

The broader commodity index, proxied by the Invesco Commodity Index ETF (DBC), strengthened materially in z-score (0.91 to 1.25). This reflects stabilization from oversold levels. Commodities also exhibited improving relative strength versus equities, supporting the case for increasing commodity allocations as part of a multi-asset framework.

Currencies:

The US Dollar Index (DXY) has peaked, with a z-score holding at 1.80, while momentum models are neutral. However, other major currencies have not confirmed a sustainable reversal versus the dollar.

Downtrends in EUR/USD and GBP/USD stabilized over the past quarter with oversold signals intact. These currencies could provide early rotation plays if the dollar index confirms a long-term trend shift below 100.

USD/JPY continues to hold a “long” signal, supported by a positive z-score. This pair remains a leader in relative strength and has been the preferred bullish USD expression. However, the pair is increasingly overbought, and could be vulnerable to pullbacks.

Meanwhile, commodity currencies (AUD, NZD, CAD) remain weak across z-scores and models, confirming their ongoing relative underperformance.
This environment favors a selectively defensive stance: long high-quality bonds and select commodity exposures like gold. A defensive rotation can be funded by trimming risk exposure in stretched equity markets. Tactical plays exist in EM assets.

Risk/Reward

The following charts compare long-term generic momentum scores with respective z-scores. Assets in the top left quadrant are favorable because of their improving momentum scores from oversold price levels. Assets in the bottom right quadrant are unfavorable because of their negative momentum scores and overbought price levels. 
​
Equities
​
  • Hong Kong equities captured upside momentum and price remains below long-term average levels.
  • Brazil has a more balanced position, although upside momentum has waned.
  • Developed markets (and India) are trading well above average levels, and Japan's Nikkei Index registered negative price momentum.
Picture
Commodities
  • Platinum and Palladium remain below average, although momentum has stabilized, while grains remain out of favor.
  • Oil, sugar, copper, and the broad commodity index are more balanced.
  • On the extreme end, coffee and cocoa are trading well above average, while Orange Juice registered negative momentum from overbought price levels.
  • Gold and Silver are trading above average levels, although momentum remains positive.
Picture
Fixed Income
  • 7-10 Year Treasury Bonds captured upside momentum and price remains slightly below long-term average levels, while long duration Treasuries are deeply oversold but lacking strong momentum relative to the belly of the curve.
  • Overall, government bonds are improving, while riskier credits appear stretched.
Picture
Currencies
  • The US dollar saw upside momentum weaken, especially versus the Japanese yen - making USD/JPY the most extreme pair in our coverage based on its z-score. 
  • GBP/USD appears most favorable given improving momentum and a more balanced z-score.
  • Commodity currencies like AUD, NZD, and CAD remain oversold with negative momentum.
Picture
Relative Ratios
  • There is a clear shift in opportunities away from US assets and toward more defensive/international assets.
  • Copper versus gold remains oversold with improving momentum, while China has emerged from oversold levels and is starting to advance relative to the broader EM index.
  • In the US, value and equal-weight exposures remain oversold, but will require stronger momentum to command greater preference.
Picture

Price ​Dispersion

 Variability of recent quarterly price action relative to the 10-year average price level, ranked by asset. Price ratios demonstrate the strength of one asset versus another, ranked by their deviation from a relative mean.
Z-score Ranking
Picture
Picture

Portfolio Process

Tactical Positioning

Long-term diversification has been the standard investment motto to enhance returns and reduce volatility. Sometimes, investors struggle to determine the appropriate asset mix based on changing objectives, market cycles, and correlations. We researched this dilemma, especially given recent challenges to the global 60% equity/40% bond portfolio amid a high inflation regime. The correlation between stocks and bonds has fluctuated, US equity valuations appear stretched versus global equities, and commodities remain broadly under-owned versus equities. Despite high uncertainty in the current market cycle, new trends may emerge, presenting both challenges and opportunities for diversified portfolios.

Adding trend following to portfolios comprised of global equities (US, DM ex-US and EM), an active equity sector rotation sleeve, global bonds, and commodities is an agile alternative to the standard global 60/40 portfolio. The commodity sleeve is an important addition because of its ability to produce a roughly 8% annualized total return with lower volatility and a higher Sharpe Ratio (risk-adjusted return) versus  a global 60/40 portfolio, according to research by AQR. We also noticed lower historical correlations between commodities and bonds, especially during times of inflation uncertainty. Commodities are also advantageous to balanced portfolios when economic growth surprises to the upside despite the potential for higher inflation. 

The trend following process is designed to allocate to each asset class segment when there is improving relative strength and momentum. Selections within each segment are made on a relative basis between holdings and versus the sleeve's benchmark. This process ensures optimal positioning without having to forecast economic regimes. 

​Recent positioning:

Currently, the model triggered fresh sell signals in equities and long signals in Treasuries, although they will need to be confirmed as of the April close. The portfolio further reduced its US equity position, which was a longstanding overweight, and increased its position in intermediate-term Treasuries. These changes will move the portfolio to an overall equity underweight, choosing instead to balance emerging markets and US stock exposures. Adding 7-10 year Treasury bonds will significantly narrow the portfolio's longstanding bond underweight. The traditional 60/40 benchmark could face additional volatility this year, which is why the portfolio maintains hedges in gold and inflation beneficiaries. 
The slight defensive tilt, however, is more cyclical in nature based on the portfolio's overweight to energy and materials relative to the global 60/40 benchmark. This results in a hedge against economic uncertainty and the potential for elevated inflation, funded by a reduction in equities and neutral positioning in bonds.
Correlations between Gold, Stocks, Bonds
Gold's correlation with stocks has spiked while the stock/bond correlation declined.
Currently, gold offers less diversification versus stocks.
Correlations between Gold, Bonds
However, compared with bonds, gold offered a slight hedge ahead of the market sell-off.
Gold/S&P 500 Price Ratio
Gold is starting to improve relative to US stocks.
Picture
Picture
Picture

Meet the Team
Follow on LinkedIn
Technical Data 

​The Dantes Outlook team consists of diverse practitioners skilled in data analysis and portfolio management, operated as a trust.
Portfolio Strategy 

Market research is purely data-driven and always interpreted with portfolio theory. We value strong risk/reward profiles, relative strength, and aligning long-term objectives with reasonably expected returns. 
Picture
Copyright 2025 / Dantes Outlook LLC
Content is for informational purposes only, not investment advice.
  • Market Intelligence
  • Past Insights
  • Long-Term Value